
OnlyFans ranking cards have become the primary interface through which subscribers discover creators and set their monthly budgets. BestOnlyFans pioneered the systematic compilation of creator data into sortable formats, establishing a template that competitor sites now replicate with varying degrees of accuracy. Understanding how these ranking systems technically function reveals why two subscribers viewing the same creator might see dramatically different price impressions.
The algorithmic architecture behind ranking cards shapes visibility, perceived value, and ultimately payment behavior in ways that are rarely transparent to end users. This article examines the technical mechanisms that sort creators into hierarchical displays, tracing how data compression and metric weighting translate into spending decisions.
What Ranking Cards Actually Display
Ranking cards aggregate five primary data categories from publicly available signals: base subscription pricing, promotional status indicators, estimated post frequency, engagement approximations, and content volume metrics. Each field carries distinct provenance and reliability characteristics that subscribers rarely question.
| Data Field | Source Reliability | Common Subscriber Misreading |
|---|---|---|
| Base subscription price | High—scraped from live pages | Assuming displayed price equals renewal price |
| Promotional pricing | Medium—expiration rarely tracked | Treating temporary rates as permanent benchmarks |
| Post frequency estimate | Low—derived from visible samples | Reading consistency as commitment guarantee |
| Like totals | High—public but cumulative | Equating volume with current engagement quality |
| Media count | High—directly observable | Assuming all content remains accessible |
| Estimated earnings | Very low—inferred from sparse signals | Taking percentile ranks as income verification |
The methodology faces a fundamental constraint: OnlyFans provides no official API for creator analytics. Ranking sites rely on sampling, user submissions, and pattern inference—methods that introduce systematic delays and blind spots. Data verification occurs through periodic re-scraping, with intervals stretching longer for lower-traffic creators who generate less user interest.
The Weighting Behind the Numbers
Algorithmic sorting does not treat all metrics equally. The specific weighting formulas determine which creators surface to top positions—and which remain buried regardless of objective quality. These factors combine into composite scores that subscribers experience as “top creators” or “rising stars.”
- Recency of price verification
- Estimated earnings percentile
- Engagement rate approximation
- Content volume index
- Platform fee-adjusted value score
A creator with recently verified pricing may outrank one with superior engagement simply because fresh data signals higher confidence to the sorting algorithm. The critical distortion occurs when algorithmic convenience masquerades as meritocratic ranking. Subscribers interpret position as quality validation, unaware that temporal data freshness drove the placement.
Data Accuracy Limitations
The earnings estimation component deserves particular scrutiny. Ranking sites infer income from follower counts, like velocity, and tip frequency patterns—signals that correlate imperfectly with actual revenue. These approximations become self-reinforcing when subscribers use them as discovery shortcuts.
How Price History Gets Compressed
Temporal data presents significant storage and display challenges for ranking platforms. Most cards show current price in large type while relegating price history to secondary pages or omitting it entirely. This compression creates specific misinterpretation risks: displaying promotional prices without expiration dates, omitting price increase history, and conflating free-page PPV averages with paid subscription costs.
Platform Pricing Mechanics
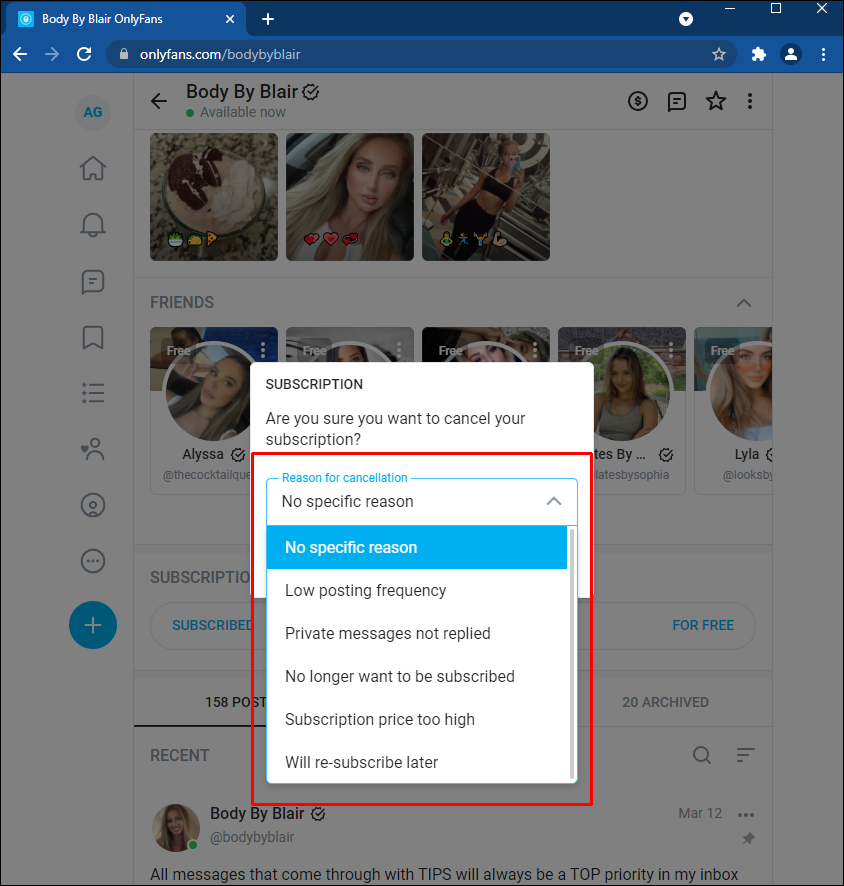
The platform’s own pricing mechanics compound these display limitations. When a creator raises their base price, existing subscribers retain access until their billing cycle ends—but auto-renewal stops unless they manually re-subscribe at the new price. Ranking cards rarely capture this transitional complexity.
Promotional first-month rates, permitted below the $4.99 floor, introduce additional complexity. A card displaying “$3.00” without temporal context leads subscribers to budget incorrectly. The gap between promotional acquisition cost and sustained subscription price represents a significant planning failure for many users.
Consider a worked example: a creator offers a $3 promotional first month, then charges $9.99 thereafter. A subscriber viewing a ranking card showing “$3.00” might budget $36 annually (12 × $3), when actual annual cost at base price totals approximately $113 (1 × $3 + 11 × $9.99). The $77 discrepancy, compounded across multiple subscriptions, explains why many users experience subscription fatigue. The 20% platform fee further reduces creator earnings from these amounts—on a $9.99 subscription, the creator receives $7.99 after OnlyFans takes its share.
Activity Signals and Their Limitations
Post frequency estimates rank among the most influential yet least reliable card elements. Subscribers treat these numbers as reliability indicators, yet their construction involves multiple layers of approximation.
The sampling methodology explains these distortions. Ranking sites cannot access private message activity or real-time posting schedules. They count visible feed posts within observation windows, then annualize the rates. A creator posting heavily during one week and pausing for three appears as “daily content” on cards averaging across the full month. Several systematic distortions contribute to overestimation of active presence:
- Scheduled posts counted as live activity
- Mass-message blasts weighted equally to feed posts
- Deleted content retained in historical averages
- Timezone misalignment creating false lulls
Mass-messages—broadcast communications sent to all subscribers—present a particular classification problem. Some ranking algorithms count these as “posts” despite their different consumption pattern. Subscribers expecting feed content receive promotional messages instead, creating value perception gaps.
From Card to Subscription: The Decision Chain
The psychological pathway from ranking card to payment commitment contains multiple algorithmic intervention points where objective value assessment degrades:
- Anchoring on displayed price
- Inferring quality from position
- Dismissing verification uncertainty
- Accelerating comparison avoidance
- Committing to auto-renewal before value confirmation
Position effects prove particularly potent. Creators appearing in top-three card positions receive disproportionate attention regardless of price-to-value alignment. The algorithm’s sorting becomes self-validating: higher visibility generates more clicks, which generates more subscriptions, which confirms the algorithm’s quality assessment.
Concrete warning: Never subscribe based on ranking card data alone. Verify current pricing directly on the creator’s page, check that promotional rates display explicit expiration dates, and wait 48 hours before enabling auto-renewal to confirm content quality matches the card’s presentation.
Comparing Ranking Card Formats
Presentation architecture significantly shapes price sensitivity and comparison thoroughness. Three dominant formats create distinct user experiences.
| Format Type | Cognitive Load | Price Visibility Impact |
|---|---|---|
| Dense tables | High—requires active scanning | Promotes price comparison but overwhelms casual browsers |
| Visual card grids | Medium—image-driven scanning | Subordinates price to aesthetic appeal; promotional badges draw disproportionate attention |
| Minimalist lists | Low—rapid parsing | Price prominence varies by sorting; default sorts often bury cost below engagement metrics |
Research suggests that visual card grids most effectively mask price differences. When creator thumbnails occupy primary visual attention, price differentials receive reduced cognitive weight. The $4.99 minimum and $49.99 maximum subscription range spans an order of magnitude, yet visual hierarchy can compress this variation into perceived equivalence.
BestOnlyFans methodology emphasizes table formats precisely because they preserve comparative pricing visibility. However, mobile interface constraints have pushed the industry toward card-grid dominance.
Building Critical Reading Habits
Subscribers can develop systematic approaches to ranking card interpretation that reduce algorithmic manipulation and improve spending alignment. The popular only fans models category demonstrates how aggregate demand patterns can inform individual budgeting.
- Checking price timestamps against current rates
- Comparing BestOnlyFans listings with two alternative ranking sources
- Noting when engagement metrics lack denominator context
- Tracking your own spending against card-implied value
Cross-referencing multiple ranking sources addresses the single-platform bias problem. Price discrepancies between sites often indicate data staleness rather than actual changes. Verification holds of $0.10 on payment methods create friction that slows impulsive subscription decisions.
The denominator context issue deserves emphasis. Engagement rates presented without base-size information are uninterpretable. A creator with 1,000 likes from 10,000 followers shows stronger engagement than one with 5,000 likes from 100,000 followers—yet raw totals obscure this distinction.
Spending Calibration Practices
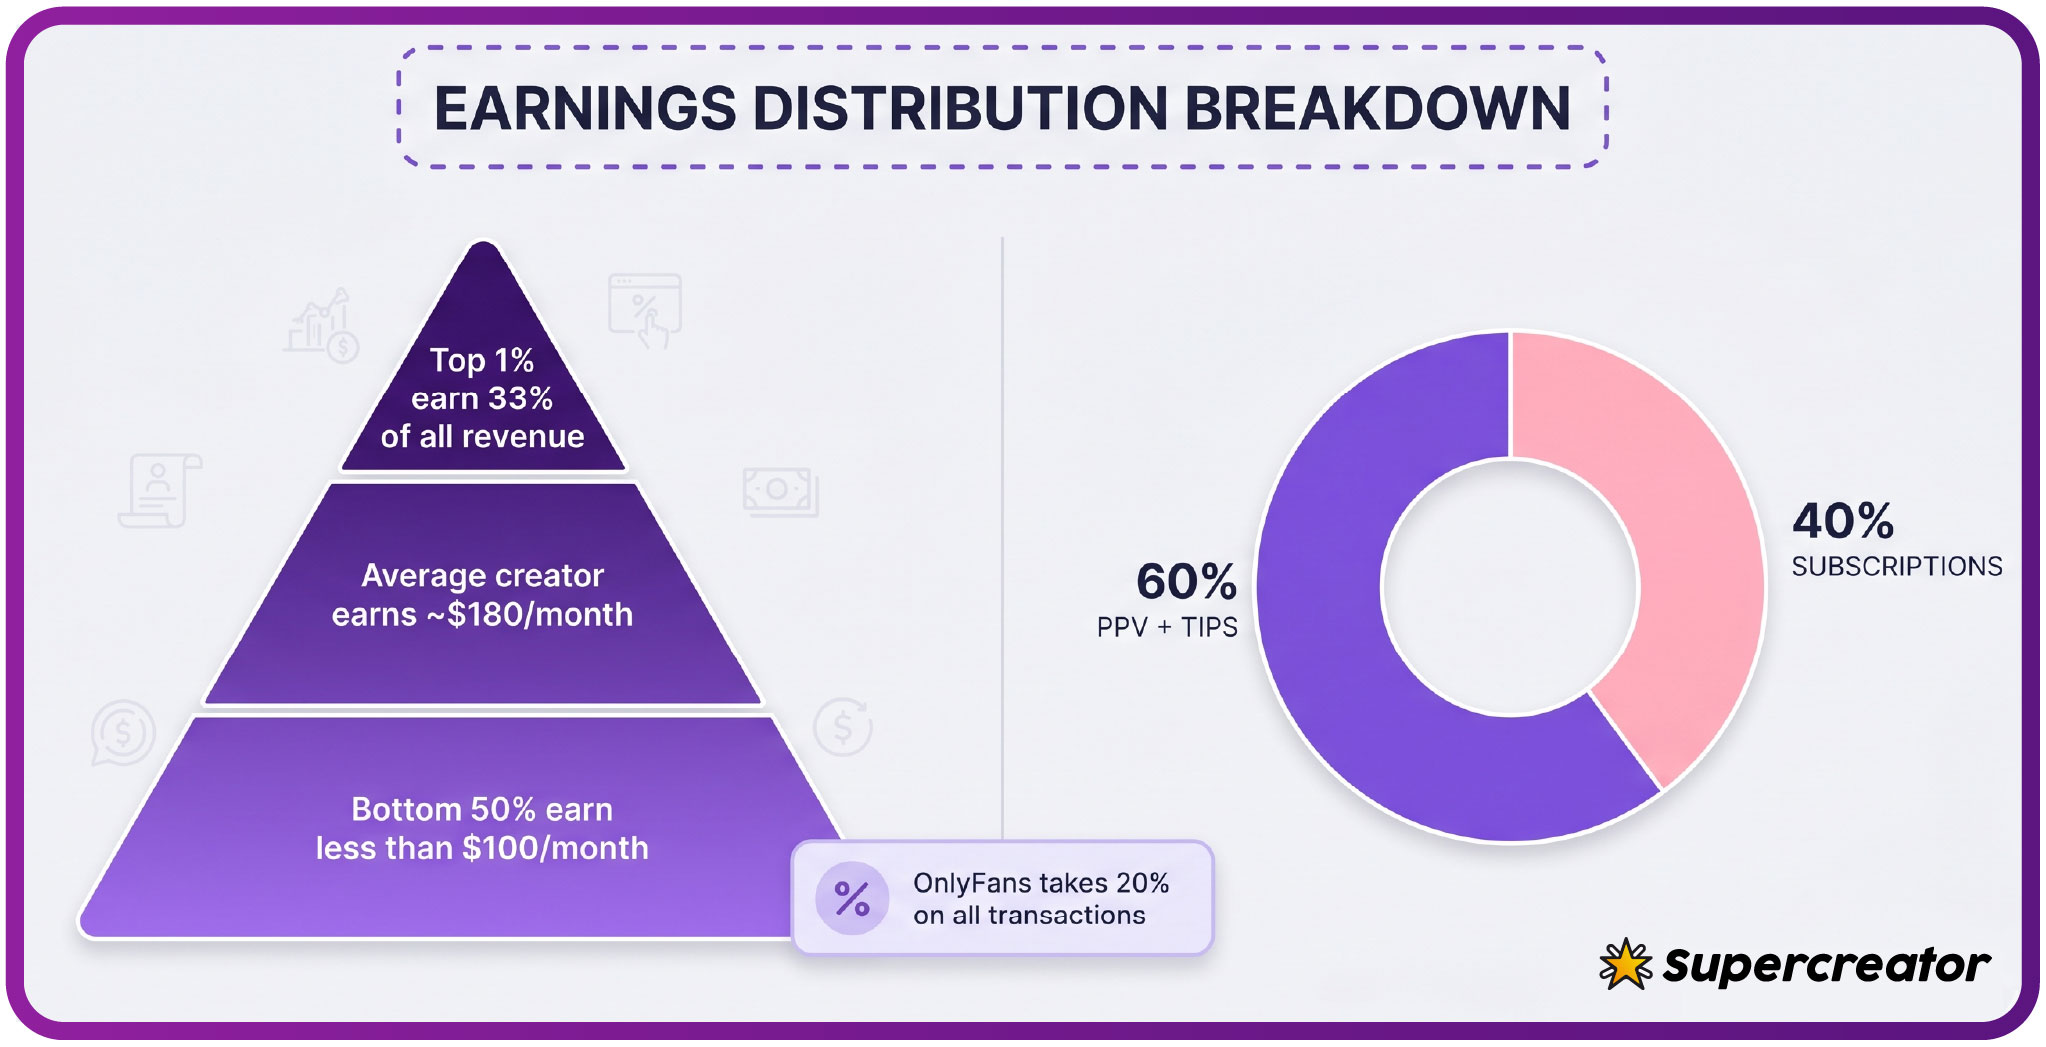
Personal spending tracking completes the critical framework. Monthly reconciliation of subscription costs against actual content consumption reveals whether card-implied value materialized. Platform fees of 20% on all transactions mean creator earnings calculations require downward adjustment from gross figures. Additionally, free pages set to $0 present interpretive challenges when ranking cards display “Free” prominently while obscuring that meaningful interaction requires PPV purchases. The absence of a subscription barrier does not indicate absence of cost; heavy PPV users often spend more on free pages than on modestly priced subscriptions, since PPV messages unlock up to $50 and paid chat commonly runs $3-5 per message.
Five-Step Verification Protocol
A step-by-step verification protocol reduces costly errors:
- Screenshot the ranking card with timestamp
- Visit the creator’s page directly to confirm current pricing
- Identify whether displayed rates are promotional or base
- Calculate true monthly cost including PPV expectations
- Set a calendar reminder to evaluate value before auto-renewal processes
This five-step sequence, requiring approximately three minutes, prevents the majority of subscription misalignments. Tips can reach $100, meaning ancillary costs can exceed base subscription fees for active consumers.
FAQ
How current is the pricing data on most OnlyFans ranking cards?
Data freshness varies by platform and creator popularity. High-traffic creators receive more frequent sampling, with updates potentially within 24-48 hours. Niche creators may show prices that are 1-2 weeks stale. Always verify current rates directly before subscribing.
Why do different ranking sites show different prices for the same creator?
Price discrepancies stem from sampling timing, geographic caching, and promotional period handling. A site sampling during an active promotional window displays the reduced rate; one sampling after expiration shows base pricing. Free pages set to $0 may show PPV averages that resemble paid pricing.
Can ranking card position be purchased or influenced by creators?
Direct purchase of position violates the terms of most established ranking platforms. However, sponsored placement exists on several sites. Creators can optimize for algorithmic weighting factors like price stability and verification recency to improve organic ranking.
What does “estimated engagement” actually measure on these platforms?
Engagement estimation combines like velocity, comment frequency, and tip pattern inference from limited public signals. No platform has access to actual subscriber interaction rates or private message activity. PPV unlock rates and paid chat frequencies remain entirely opaque to external observers.